Skip to content
Oxyn logo markOxyn
  • Work
  • Gallery
  • Capabilities
  • AI
  • Pricing
  • About
Book a Call

Loading page

Start a project

Tell us about your project.

Book a Callor email oxyn.solutions@gmail.com
Oxyn logo markOxynAI software OS

OXYN designs analytics platforms, automations, websites and software products with AI built into the work rather than bolted onto it.

Email
oxyn.solutions@gmail.com
Based
Remote — worldwide

Work

  • Selected work
  • Gallery
  • Analytics
  • Software

Capabilities

  • Analytics & Dashboards
  • Software Development
  • AI Integration

Company

  • About
  • Contact

© 2026 OXYN. All rights reserved.

LinkedIn (opens in a new tab)GitHub (opens in a new tab)Back to top ↑

Analytics & Dashboards

Turn complex data into decisions.

Interactive dashboards and analytical systems that turn business data into actionable information.

What we build

Typical solutions

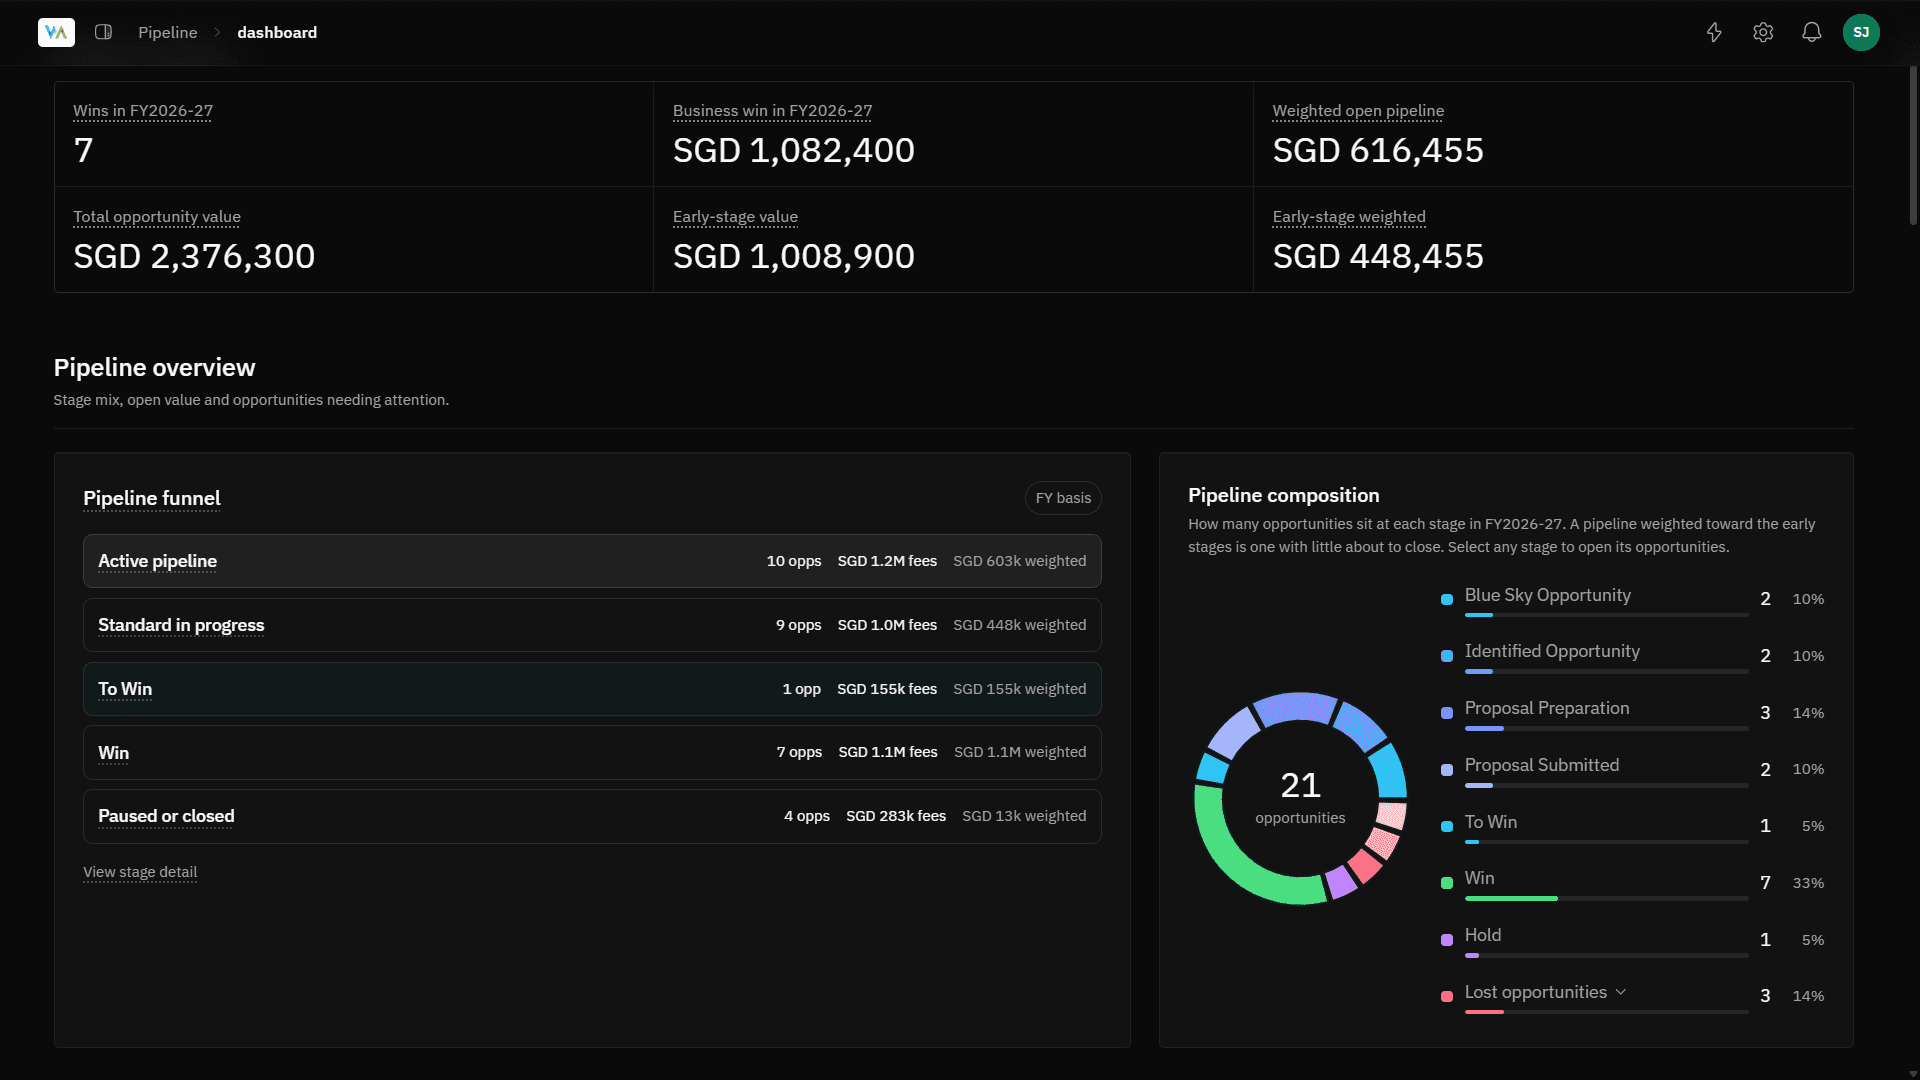
  • Operational dashboards

    Built for the people who check them every morning. We start from the decisions a team makes each day and put exactly those numbers on screen, refreshed often enough to act on.

    • Near-real-time refresh from your source systems
    • Targets, thresholds and alerts on the metrics that matter
    • Drill-down from the headline number to the individual record
    • Views tailored per team, role or site
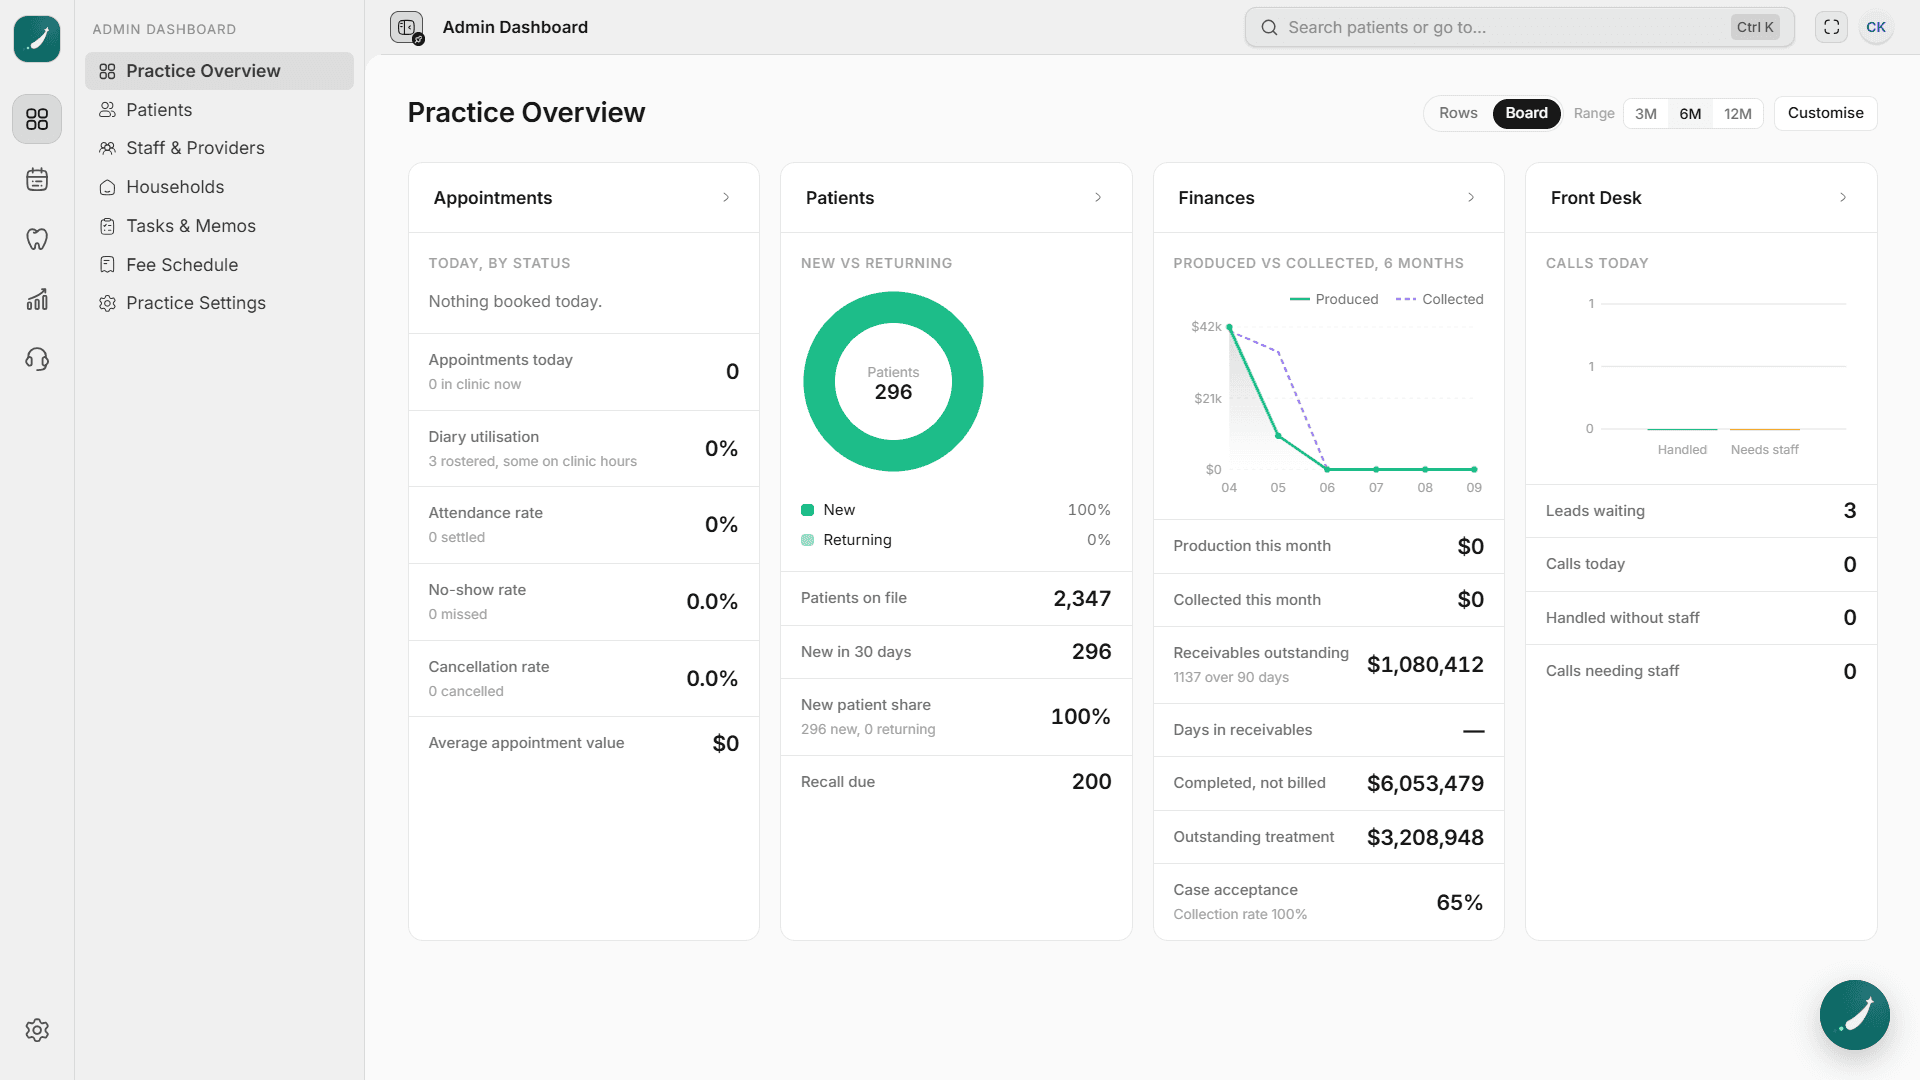
Operational dashboards

Built for the people who check them every morning. We start from the decisions a team makes each day and put exactly those numbers on screen, refreshed often enough to act on.

  • Near-real-time refresh from your source systems
  • Targets, thresholds and alerts on the metrics that matter
  • Drill-down from the headline number to the individual record
  • Views tailored per team, role or site
AI

Where AI fits into analytics

  • Natural-language queries

    People who don't write SQL can still get answers. Questions are translated against your governed data model, so results match the dashboards instead of inventing their own numbers.

    • Grounded in your metric definitions, not raw tables
    • Shows the query behind every answer
    • Respects the same access rules as the dashboards

Natural-language queries

People who don't write SQL can still get answers. Questions are translated against your governed data model, so results match the dashboards instead of inventing their own numbers.

  • Grounded in your metric definitions, not raw tables
  • Shows the query behind every answer
  • Respects the same access rules as the dashboards
How we use AI
Work

Selected projects

Finance Dashboard

Analytics

Dental Dashboard

Analytics

View all work
Process

How an engagement runs

  1. Model the data

    Agree the metrics and build a model that defines them once.

  2. Design the view

    Lay out the questions the business actually asks, in order.

  3. Build and connect

    Wire it to live sources with refresh you can trust.

  4. Add summaries

    Add insight generation where reading a chart is the slow part.